|
|
 |
 |
 |
 |
|
COLUMBIA FORUMPublic Opinion Polling and the 2004 Election
Political science professor and former department chair Robert Y. Shapiro received his Ph.D. from the University of Chicago in 1982 and has taught at Columbia since. He previously served as a study director at the University of Chicago National Opinion Research Center. Shapiro specializes in American politics with research and teaching interests in public opinion, policy-making, political leadership, mass media and applications of statistical methods. His current research examines American policy-making, political leadership and public opinion from 1960 to the present. A visiting fellow at the Council on Foreign Relations and researcher at Columbia’s Institute for Social and Economic Research and Policy, Shapiro co-authored the award-winning books The Rational Public: Fifty Years of Trends in Americans’ Policy Preferences and Politicians Don’t Pander: Political Manipulation and the Loss of Democratic Responsiveness. He serves on the editorial board of Public Opinion Quarterly (“Poll Trends” editor ), Political Science Quarterly and Presidential Studies Quarterly, and is a member of the Roper Center for Public Opinion Research board of directors. Shapiro is the editor of the forthcoming Academy of Political Science book The Meaning of American Democracy. On Dean’s Day, held April 9, he spoke to an enthusiastic alumni audience about “Public Opinion Polling, Democracy and the 2004 Election.” Here is an excerpt from his lecture. Polling has been getting a bad rap, and the recent problems with exit polls have not helped, although what happened with the exit polls in 2004 is consistent with the pitch that I want to make to you: I encourage everyone to participate in public opinion polls if a pollster contacts you, especially on Election Day, or if you are asked to respond to an exit poll. I admit that this is a bit self-serving, as this is related to what I do for a living as a political scientist — I worked on the set at ABC News on Election Night feverishly analyzing exit polls. I may be asking a lot, as we have all been overwhelmed by telephone solicitations and telemarketers, but we can now put ourselves on the national “Do Not Call List,” which seems to work. But how do you know if you are talking to a legitimate pollster or legitimate market researcher who is not after your money? The legitimate ones will identify themselves loudly and clearly, and they will start by asking a question such as, “May I speak to the person in your household who had the most recent birthday?” Or, “Who is the oldest female or youngest male?” This is a legitimate attempt at sampling individuals in households and is a sign of serious research. Aside from problems related to telemarketing and solicitations, public opinion research also is under siege because critics argue that the proliferation of polling undermines effective political leadership and government. The common wisdom is that politicians and policy-makers slavishly follow polls and don’t take action without knowing from their pollsters that this is what the public wants. The critique is that polling is bad, and the solution, according to political pundits such as Arianna Huffington, is for the public to refuse to talk to pollsters: Leaders should lead and not be swayed by poll results, which critics see happening perpetually. Bill Clinton was the poster child for this. But is there evidence to support this? Well, there was the case of Clinton’s pollster influencing where Clinton went on vacation. More compelling, during the 1996 election, public opinion figured into Clinton’s decision to sign welfare reform into law and also into the Republicans voting for an increase in the minimum wage. But what’s wrong with political leaders responding to the threat by voters of being held accountable? Constitutionally, this is the one shot that voters get every two or four years. The founders of our Republic would permit no more than this, and they attempted to create a political system in which the nation’s leaders were insulated from the “whims and passions” of the masses. To this day, it is politically incorrect for a leader to go on record saying that polling is useful for responding to public opinion. George W. Bush has gone out of his way to criticize politicians paying attention to polling, but we know darn well that he and the Republicans, just like Kerry and the Democrats, paid close attention to the polls during the campaign, and that it has continued after the election. The situation is different after elections, however. If policy-makers were following the dictates of polls, research on the relationship between public opinion and specific policies would show a strong historical correspondence, issue by issue, between short-term public opinion changes and subsequent government policies, and a relationship that is becoming increasingly strong. What research shows, however, is that the opinion-policy relationship is far from perfect. While we can debate many aspects of the data, there is no support for the extreme claims in one direction or the other: Policy-makers do not purely respond to public opinion, nor do they purely attempt to lead it. The fact that political parties and politicians do polls doesn’t mean they are doing them so that they can do things that are acceptable to the public. Why is that? The reason is that politicians and policy-makers have policy and ideological goals that they attempt to pursue between elections. George W. Bush has shown this on a number of issues, especially the Iraq War, his efforts to reform Social Security and his position on Terri Schiavo. Polls historically have been used in ways that are hardly characterized by responsiveness to national public opinion but rather have been used for other purposes. I can’t do justice to the variety and complexity of this history here, but these uses have been substantially for purposes of leading or manipulating public opinion to attain policy goals or for other political purposes. There may be a fine line between what I refer to as leading and manipulating but it hardly represents politicians slavishly doing what polls tell them. Rather, they have attempted to use information from polls to move the public in the direction they want to go. I cite Franklin Roosevelt’s management of public opinion (with the help of pollster Hadley Cantril) leading to the United States’ entry into World War II, Richard Nixon’s doing the same (with pollster Robert Teeter) as he moved to gain public support for admitting China into the United Nations and Clinton, the poster boy for polling and pandering! Yes, the Clinton administration polled like crazy on health care reform, but only after the reform program was put together, and not to determine what the public would support in the plan. The polling was done to help figure out how to craft messages and a campaign to sell the plan. When this failed and the Democrats took a beating in the 1994 midterm elections, what did Clinton do? He fired his pollster, Stanley Greenberg, and replaced him with Dick Morris, who became a household name. George W. Bush might take a lesson from this on Social Security reform as the 2006 midterm election approaches. But if all this attempted manipulation is going on, why should the public talk to pollsters? The reason has to do with providing greater openness in order to challenge such efforts at manipulation. You should respond to opinion polls for reasons that have to do with democracy, but not democracy in the knee-jerk sense that political leaders should be devoted to doing what the public wants. There is ample room and a role for both leadership and responsiveness. Polls, in principle, can be stunningly democratic and especially egalitarian because they attempt to find out the opinions of a sample of everyone, not just those who have the opportunity and economic or other interest in being actively engaged in politics. In practice, there are problems in pursuing such equality of voice, but polls can strive to reach that goal. It is important for this voice to be heard in the political process through the reporting about public opinion in the media. Politicians, the press and the public at large should use, debate and wrestle with public opinion openly as a regular part of politics. We should openly discuss why political leaders should or should not be responding to public opinion. For example, the polling and reporting about public opinion in the case of the recent war and struggle for peace in Iraq is something we should strive to improve, not eliminate, as critics would argue. The same applies to the debate on Social Security reform. As part of free speech and unfettered debate in a democracy, we should be free to discuss public opinion and polling openly. The public should respond to polls for another broader reason — a non-political one. To tell people not to respond to polls would deny us the means to understand better and reflect upon our history, our society and our nation. Just as we have learned about our population and demographics and other changes from the U.S. Census and all kinds of other government-sponsored surveys (done to serve the public good, which we should not forget), so we also have learned much about change and stability in American public opinion since 1935, when George Gallup and others began to do surveys. Here are a few examples.
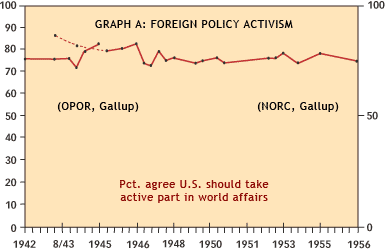
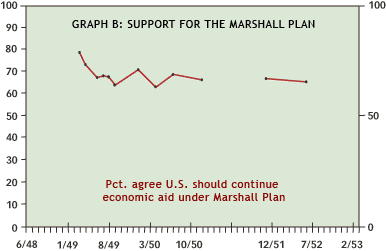
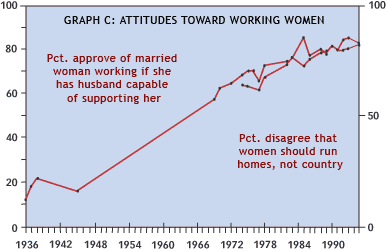
Survey research tracked the profound transformation in American public opinion from pre-World War II isolationism to large majorities during the war and, continuing to this day, supporting U.S. activism in world affairs (see Graph A). Note also the high level of public support for the Marshall Plan (see Graph B). Graph C illustrates the most stunning change that I have seen in the available public opinion trend data: the case of approval or disapproval of a married woman working if she has a husband capable of supporting her. Keep in mind that in 1939, Massachusetts and Illinois were apparently considering legal restrictions on the employment of women during the Depression. In 1936, only about 10 percent of the public approved of married women working compared to more than 80 percent 50-plus years later. Stop talking to pollsters? Why would we want this kind of understanding of our history — and future — to cease? My telling you to respond to pollsters has to do with a wish to track public opinion as part of learning about our history and society. It also, most importantly, has to do with a wish to promote transparency and democracy. As part of the expansion of polling worldwide, it is no accident that we find that as more countries move toward the establishment of democratic governments, polling in these countries emerges as a legitimate enterprise. We will really know more about democratic regime change in Iraq when we see pollsters working freely everywhere there, doing election and other polling of the sort we see in the United States and in democracies worldwide. The fact that two pollsters in Iran a couple of years ago were arrested, convicted and sentenced to prison is telling and stunning. Pollsters work freely in Israel and in the Palestinian areas, but Palestinian pollsters have at times had to worry about physical threats when they publish results that some factions don’t want to hear. Exit polls are done by and for the news media, less to help project election results early and more to help explain the results afterward; that is, explaining who voted for whom and why. The person who is best known for developing exit polls is a statistician, Warren Mitofsky, who taught a course at Columbia in the spring on survey research and exit polling. As to why you should participate in exit polls, I first and foremost emphasize their value in providing data to explain, not predict, election outcomes. Making early predictions on Election Day is entertainment and pseudo-news. I would also give another reason to respond to exit polls that, up until recently, was more relevant in other countries. In some countries — newly developing democracies that have histories of authoritarianism and corruption — freely conducted exit polls have provided a way to check and to validate official election results. These polls have been a way to keep the vote counts honest or to reveal fraud. This happened during the political transition in Yugoslavia where fraud was found. We’ve seen this in recent elections in former Soviet states. There was a debate about an election last summer in the state of Oaxaca in Mexico. Granted, there can be problems with biased exit polls, as a controversy last year in Venezuela showed and as we saw front and center in our recent election. In general, such independent vote counts are all for the good. So now, with all the debate about the accuracy of counting votes in the United States, which we will watch in future elections, having good exit polls to compare to the reported vote in each state is surely not a bad thing. (I emphasize the word “good.”) When I gave talks to Columbia alumni and others before the election, I emphasized responding to all polls and singled out pre-election polls. I emphasized the need for high response rates to improve data quality. I emphasized exit polls as an afterthought, figuring the exit poll data would be better anyway, as these are surveys of actual voters leaving the polls and these survey have response rates of 50 percent or higher. Well, it turns out that these 50 percent response rates alone are not high enough. So, what happened in the end with the pre-election polls and exit polls?
Here’s a quick summary. First, the pre-election polls nationally, and as far as I have seen, for most states as well, were in the end strikingly good, despite all the debates about difficulties with them. They had the election very close — too close to call in several competitive states. The average of the national polls at the end had Bush winning by around 2 percent, which was about what he won by (see Table 1). But the controversy was with the exit polls. Fortunately, this did not lead to misprojections of which candidate won which state and the overall election as in 2000, but it led to all sorts of confusion about whether it looked like Kerry would win. The real confusion was in the reporting of the early polls, which everyone should have known were not likely to be accurate, as they were warned by Edison/Mitofsky, the exit pollsters. But, by election night, when the third wave of the exit polls came in and the data were weighted/adjusted appropriately for certain sampling characteristics — but not yet for the actual counted vote in each state — the exit polls were still statistically off in a way that consistently overestimated the Kerry vote and the number of Democrats voting nationally (see Table 2). The table shows the nature of the error, in the first column for the exit poll results in each state before adjustments were made for sampling characteristics, and then in the second column once the first statistical adjustment/weighting was done, which we can compare with the final vote count in the third column. We see this net Democratic bias in many states, which casts doubt, prima facia, on claims of errors in vote counts in any particular states. The main claim that the exit polls were off came from the exit pollsters who reported that there were problems having to do with interviewer characteristics (young, Democrat-friendly?) and interviewer training, plus speculation that Democratic voters were more favorably predisposed than Republicans to respond to the polls. Given that it would have been in the pollsters’ interest to claim that their polls were right and the vote counts wrong, this lends credibility to their admitting that the polls were basically, and quite frankly, sloppier than they should have been. In the future, the exit pollsters have said, of course, that they will do better, by learning from mistakes made in 2004. But there probably would not have been these problems in estimating the election results if the exit polls had higher response rates, say, 70–80 percent or more, instead of just over 50 percent. Regardless, the exit poll data are still valid and reliable for studying how different segments of the public voted and for exploring why they voted the way they did. One lesson from the 2004 election is just say “yes” to the exit pollster — especially those of you from Ohio and Florida!
|
|
|||||||||||||||||||||||||||||||||||||||||||||||||||||||||||||||||||||||||||||||||||||||||||||||||||||||||||||||||||||||||||||||||||||||||||||||||||||||||||||||||||||||||||||||||||||||||||||||||||||||||||||||||||||||||||||||||||||||||||||||||||||||||||||||||||||||||||||||||||||||||||||||||||||||||||||||||||||||||||||||||||||||||||||||||||||||||||||||||||||||||||||||||||||||||||||||||||||||||||||||||||||||||||||||||||||||||||||||||||||||||||||||||||||||||||||||||||||||||||||


